Researching Behavioral Change to Aggregate Campus-Wide Food Waste Data
ACM CHI 2025 Publication
Duration
Oct 2024 - Jan 2025[3.5 months]
Role
Lead Researcher & Designer
Team
2 Undergraduate Researchers
1 Masters Researcher
1 Faculty Mentor
Tools
Figma, Maze
Context The ACM (Association of Computing Machinery) CHI conference on Human Factors in Computing Systems is the premier international conference of Human-Computer Interaction.
2025 Design Brief : Design a solution that contributes to one (or several) of the 17 Sustainable Development Goals identified by the United Nations
Problem Food waste is a daily reality, generating greenhouse gas emissions nationwide totaling to 170 million metric tons of CO₂ each year. At UCLA, dining hall audits show 150–250 pounds of edible food discarded per meal. Despite surplus food at universities, 44% of US postsecondary students face food insecurity. We aimed to bridge the gap between food waste and food insecurity to help develop a sustainable, responsible, and healthy community.
RESEARCH
Stakeholder interviews To understand the current problem space universities face with food waste we interviewed UCLA Dining Sustainability Representatives. Stakeholders shared their current food waste reduction tools and processes, culminating in 3 main pain points:
1
2
3
Food waste audits are done rarely and manually, making it difficult to establish proper trends.
Lack of student engagement in sustainable food consumption and food waste prevention
Food recovery resources are underutilized
UCLA Current State Food Waste Prevention Process Gap Analysis

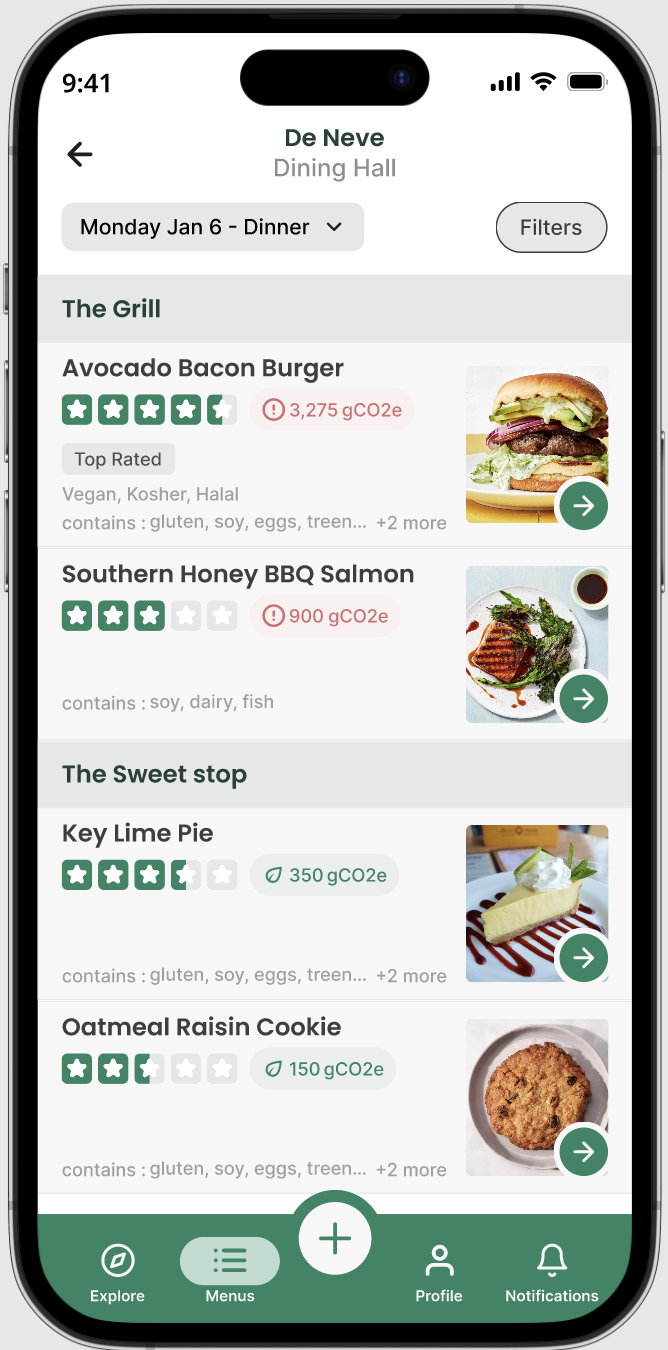
ideation In response to the manual data collection required for food waste audits, our solution RePlate was designed as a solution for students to track their own food waste while also increasing engagement in sustainability and promote food recovery options. Leveraging the food waste reduction methods explored in previous studies, RePlate utilizes food reviews to both prevent food waste and quantitatively track sustainability.
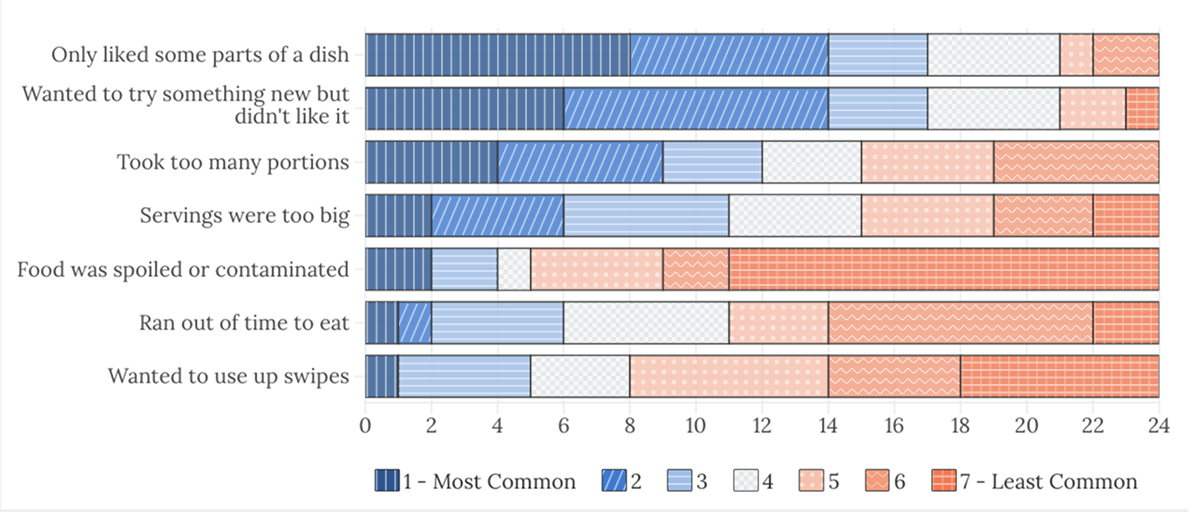
Reasons for Food Waste in UCLA Student Dining, Ranked from Most Common to Least Common
user research With a solution in mind, we met with the target user base to learn their user needs and define their current mental model of food waste and sustainability.
Insights from 24 user surveys and 3 cognitive walkthroughs provided the quantitative and qualitative data needed to shape the prototype’s core use case and inform the end-to-end flow.
DESIGN
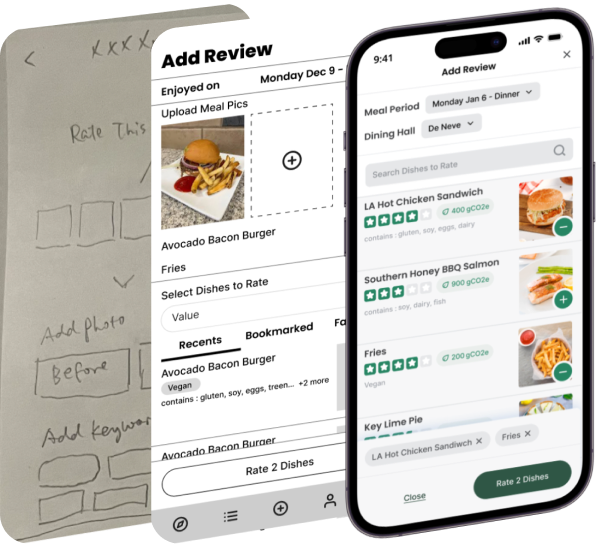
wireframing The team did a Crazy 8s session to sketch initial user flows then refined referencing similar food review apps such as Yelp and Beli for existing industry UI designs and user flows.
We found that our solution was unique, that rather than reviewing an entire restaurant we needed to enable users to review each dish, needing for us to design net new flows as well.
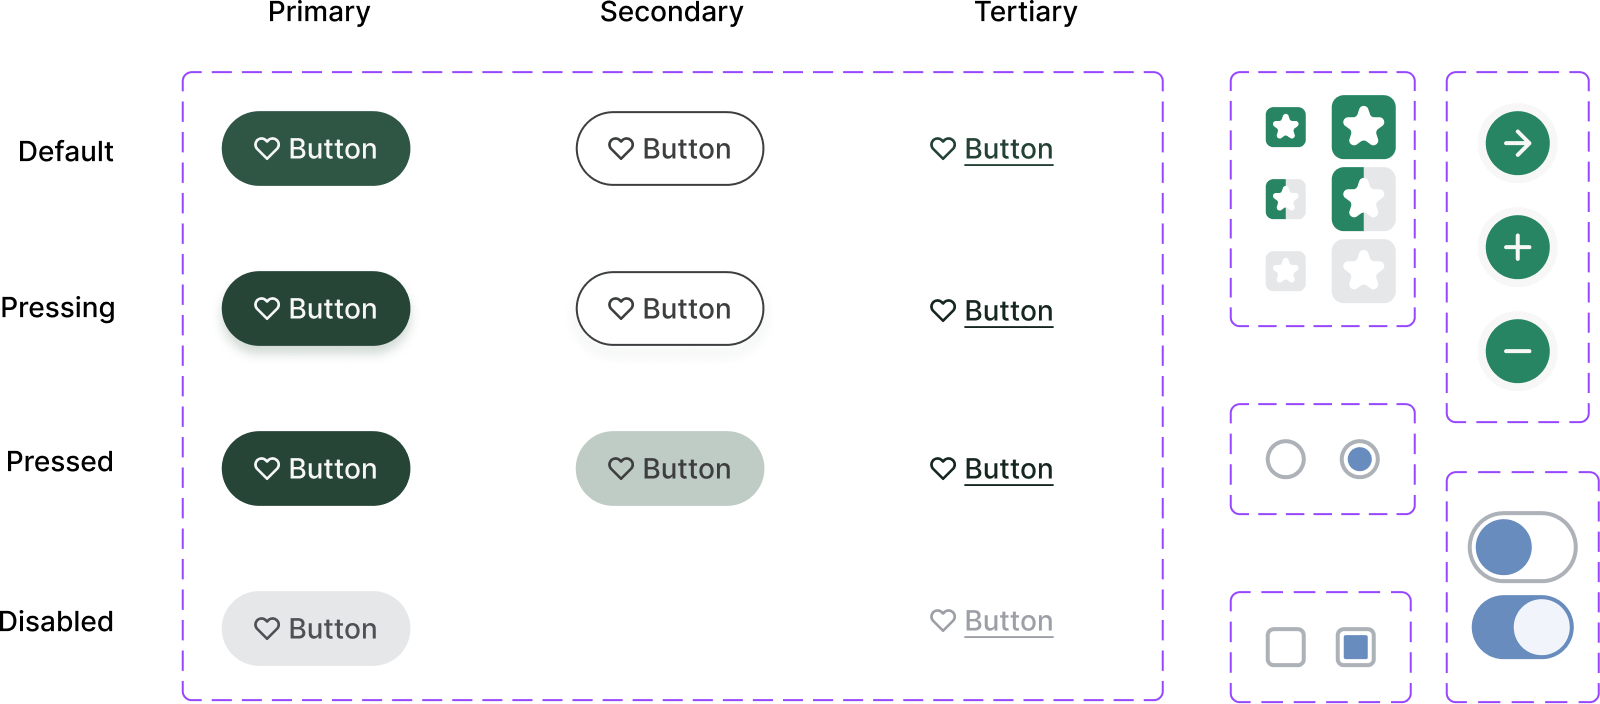
Design System We created a design system for visual coherence and consistency. We created Figma component sets to create a library of reusable UI to use throughout the app.
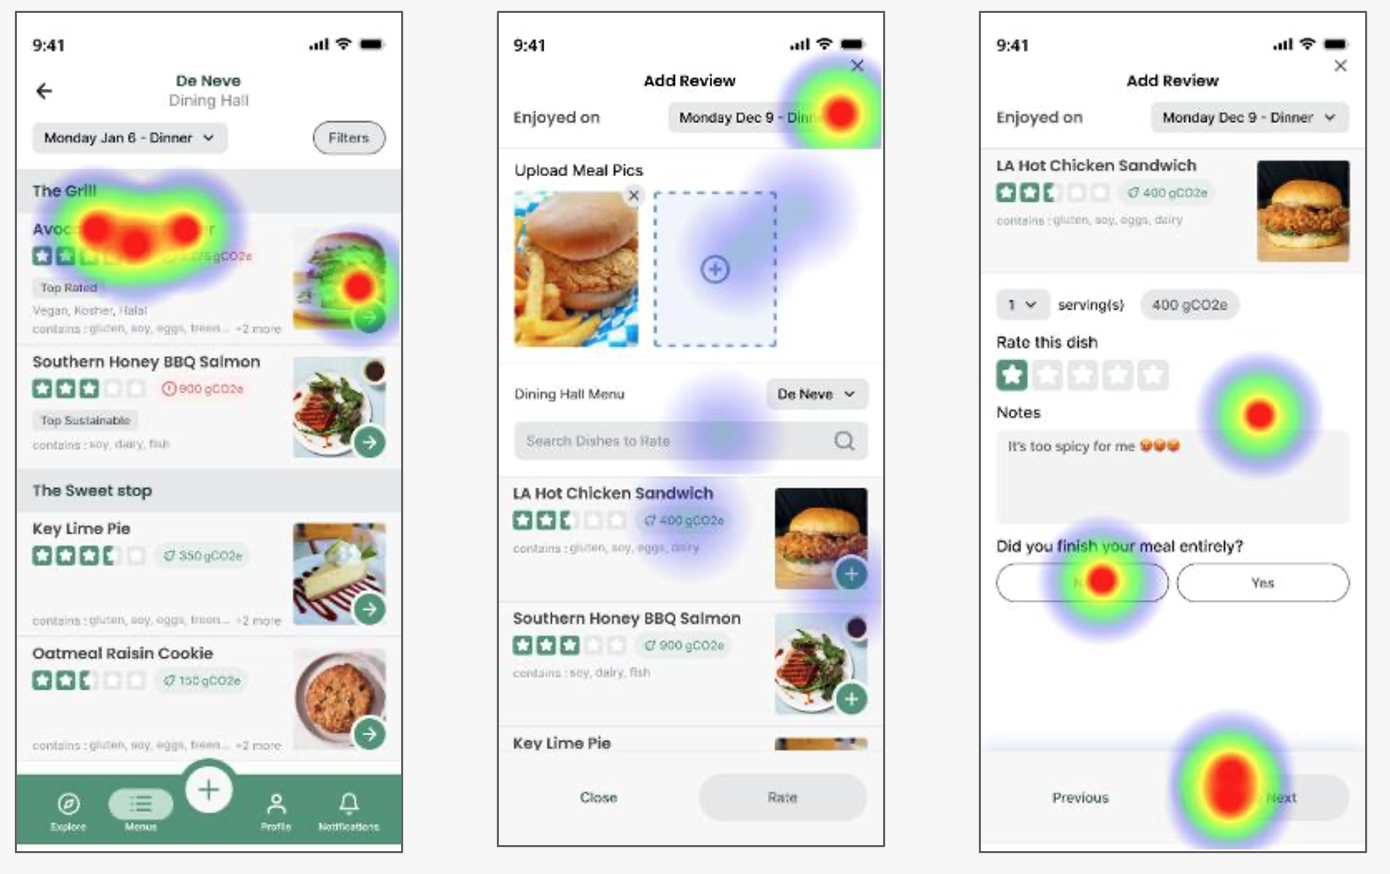
usability testing We used the platform Maze for usability testing, allowing participants to explore the app and complete tasks. This helped us evaluate user flows and user comprehension, uncovering insights for design improvements in error prevention and aesthetics that were concise.
First Iteration
Improvement
sustainability scores are too precise to quickly compare
+middle tier for sustainability score
Prob 1: the carbon scores were too precise, which increased the time taken to compare menu items.
Improvement: A middle tier of carbon scoring was added with a yellow color and with no icon so users could have another visual distinguisher between items.
First Iteration
Improvement
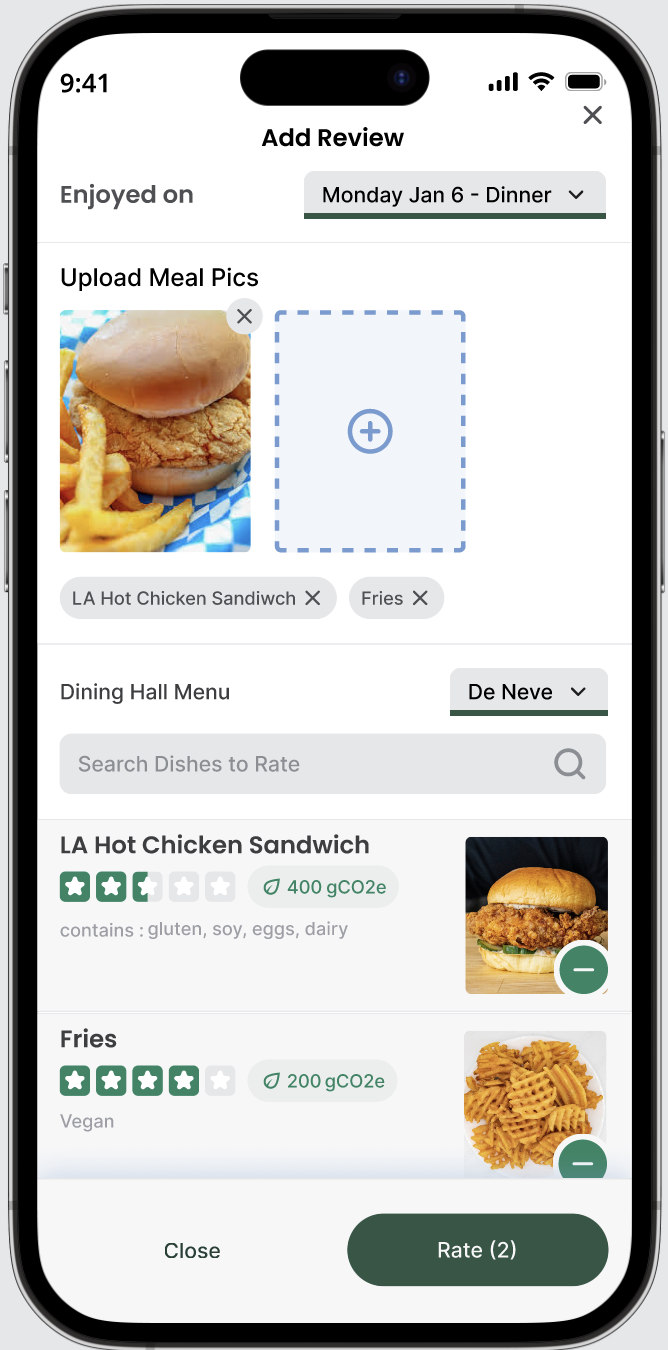
Unclear menu is multi-select
+moved user selections closer to CTA
Prob 2: participants would try to progress to the rating process before selecting all dishes
To improve: Reordered information hierarchy to put menu items first and moved user selections closer to the call to action button to further suggest the menu items are multi-select options
First Iteration
Improvement
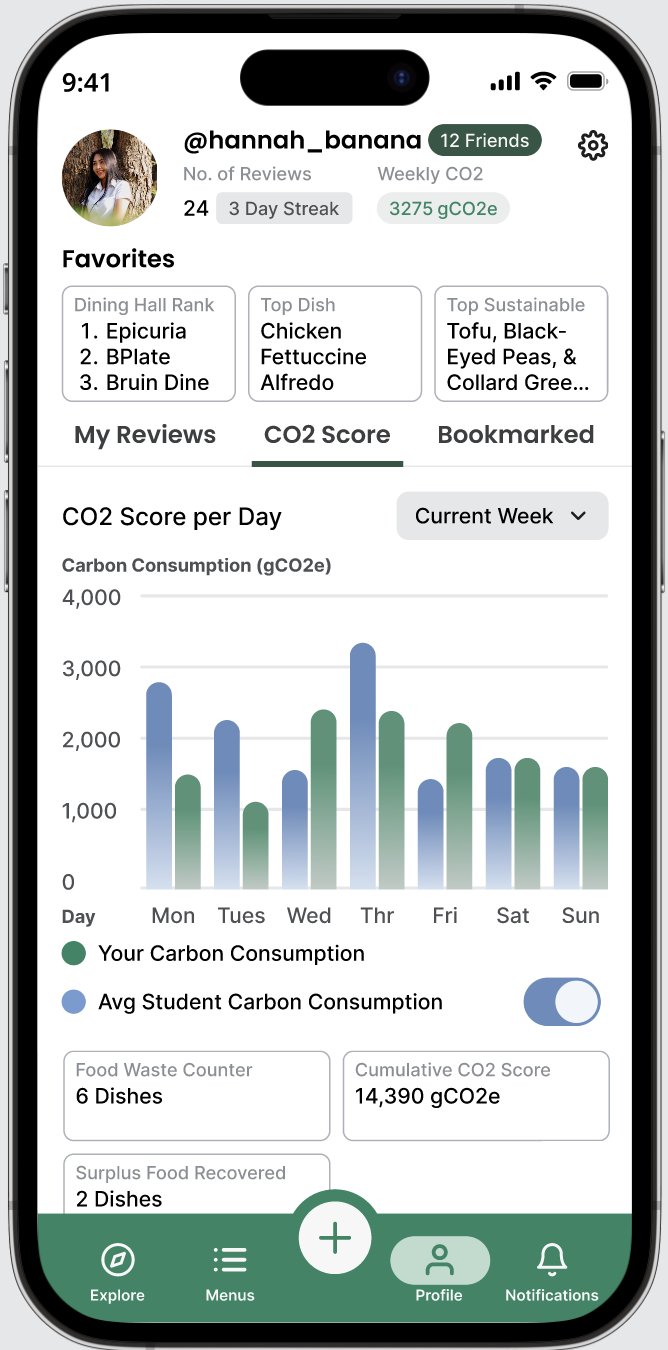
Graph is hard to read and interpret sustainability
+changed graph type and added interpretation widget
Prob 3: Graph was visually dense and hard to infer sustainability
To Improve : Revised data visualization to visually separate elements using bars and line graphs, and widgets were provided to help interpret the user’s carbon score.
RESULTS
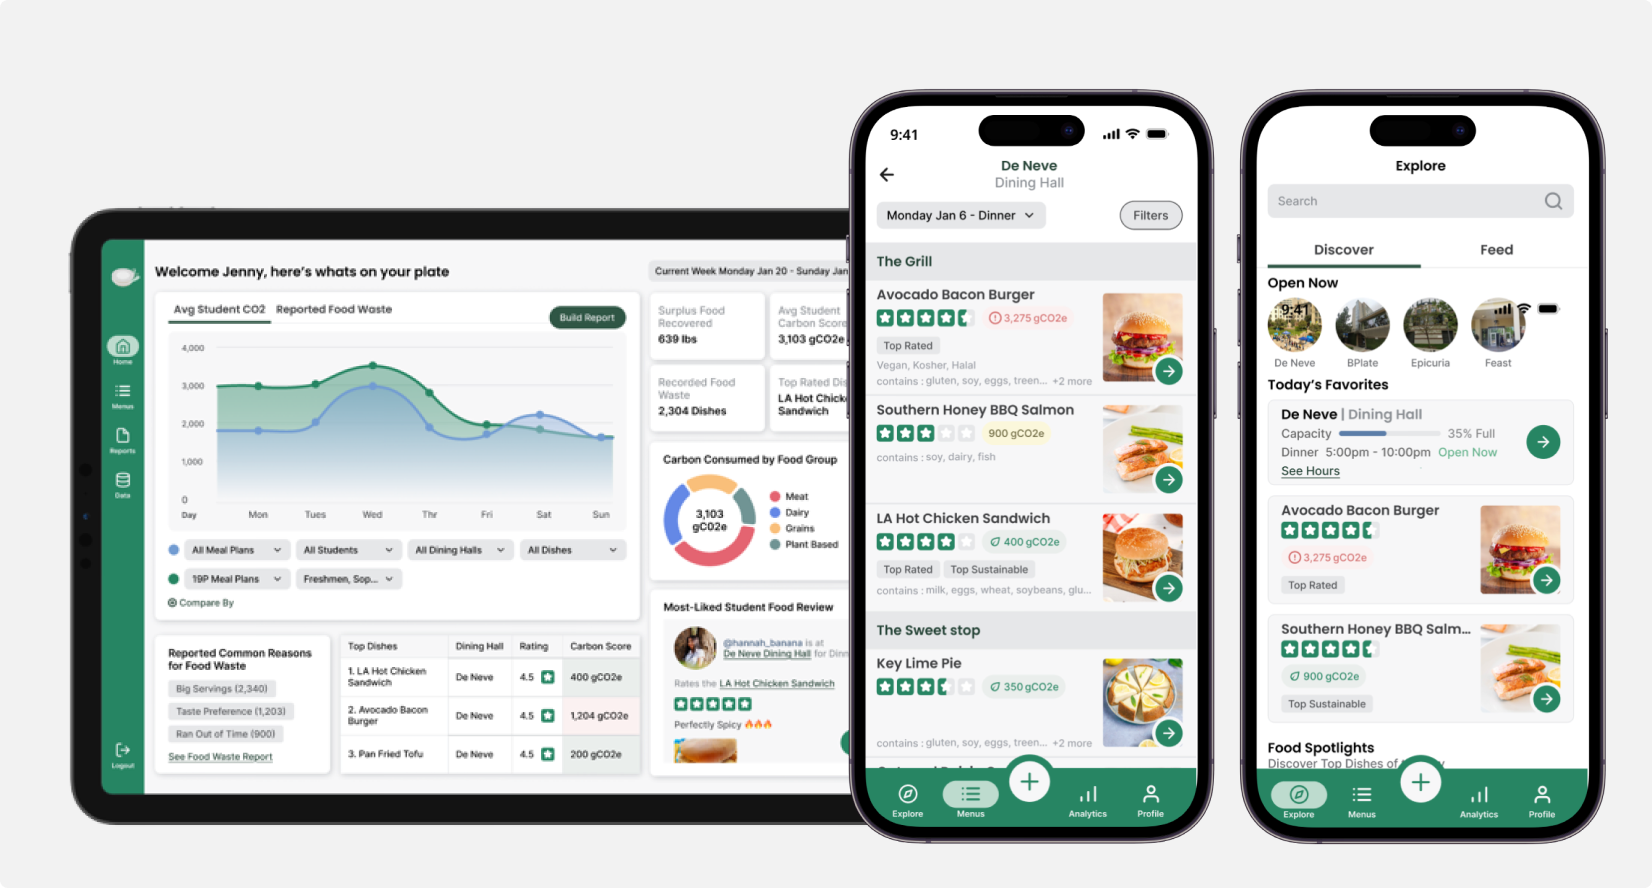
results Cumulating our research from stakeholders, previous research studies, and user feedback we designed a prototype concept for a campus food waste prevention app.
Our research paper on the project was among the 26% of submissions accepted to publish in the ACM CHI 2025 research journal and present in Yokohama Japan.
Explore
Search

Discover
Feed
9:41


Explore

Menus


Analytics

Profile
Open Now

De Neve

BPlate

Epicuria

Feast
Today’s Favorites
De Neve | Dining Hall
Capacity
35% Full

Dinner
5:00pm - 10:00pm
Open Now
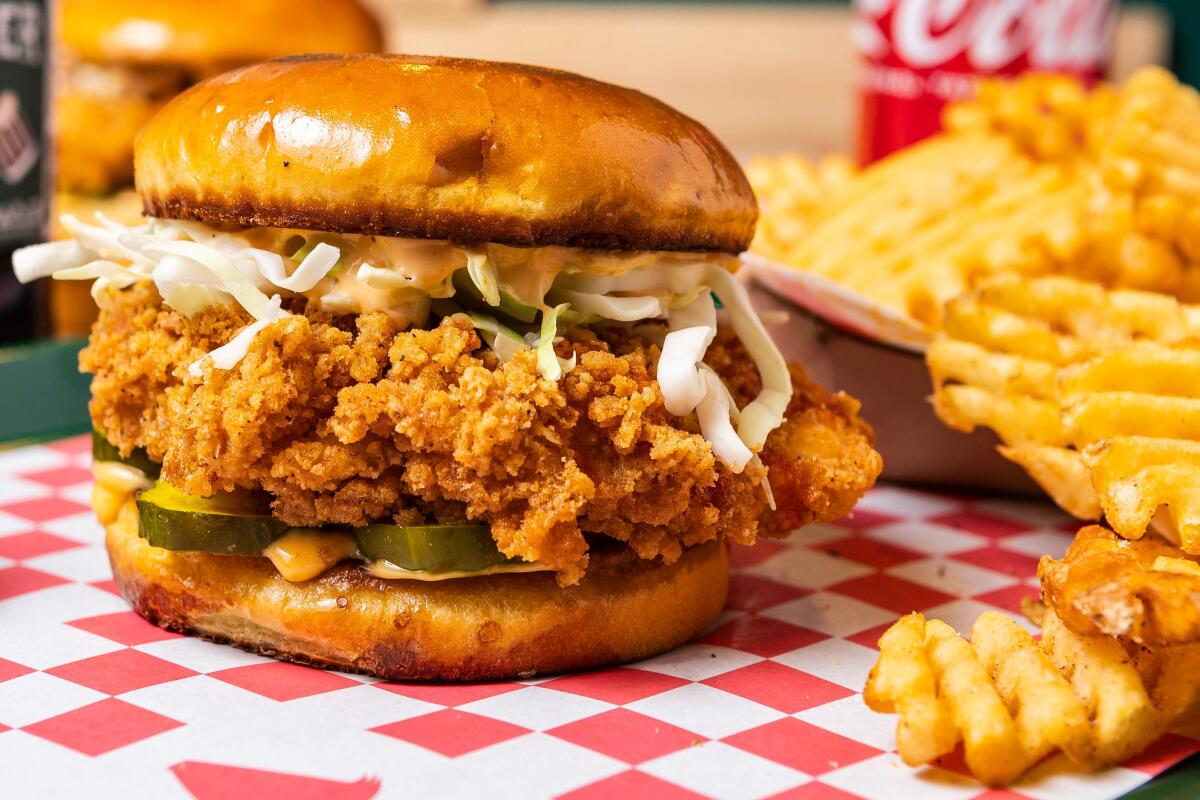
Avocado Bacon Burger


3,275
gCO2e
Top Rated

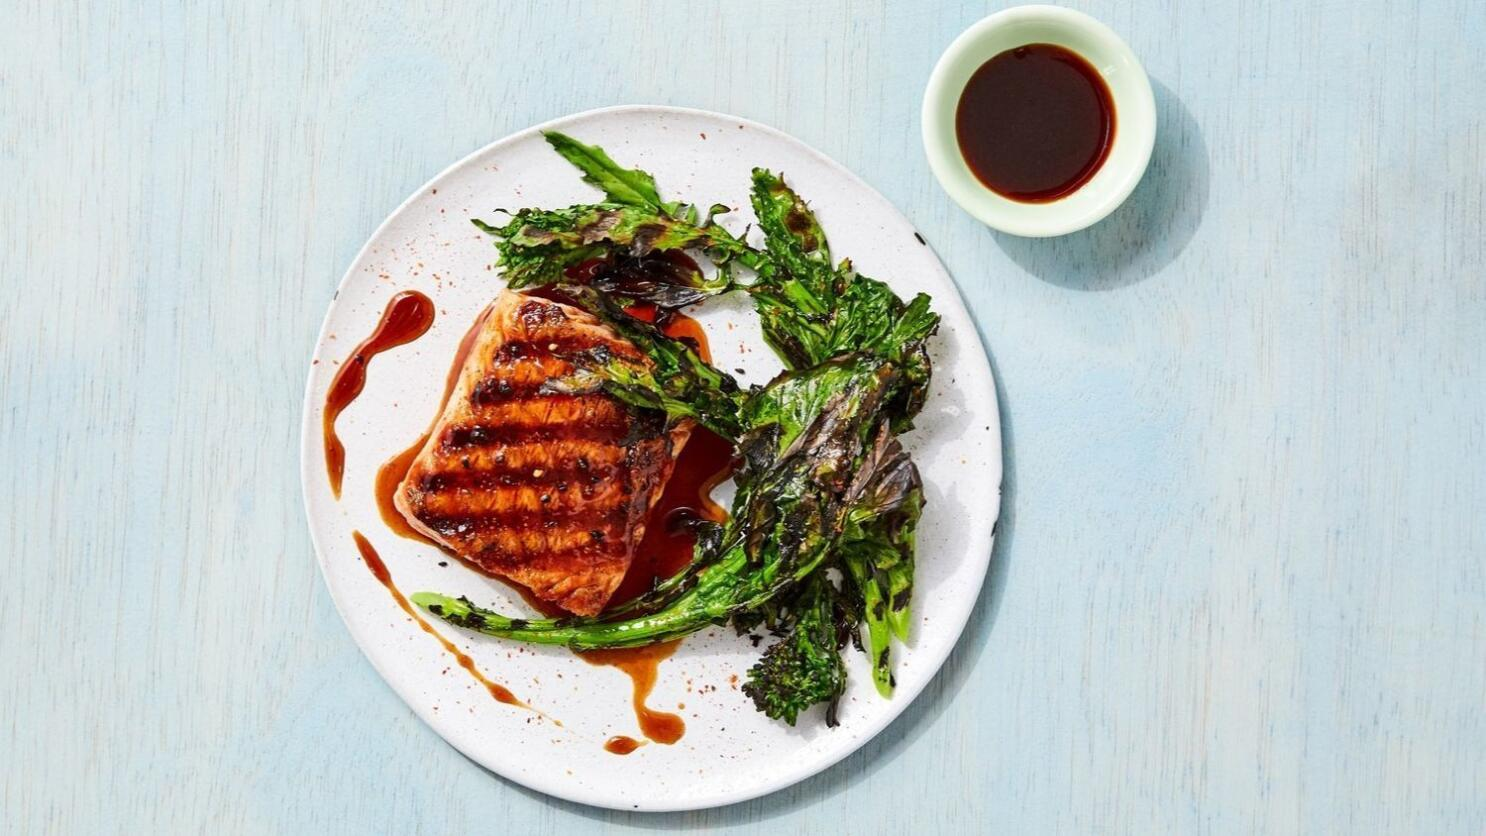
Southern Honey BBQ Salmon

900
gCO2e
Top Sustainable
Food Spotlights
Discover Top Dishes of the Day
Avocado Bacon Burger

4.5
3,275
gCO2e

Honey Walnut Shrimp
4.1
2,200
gCO2e
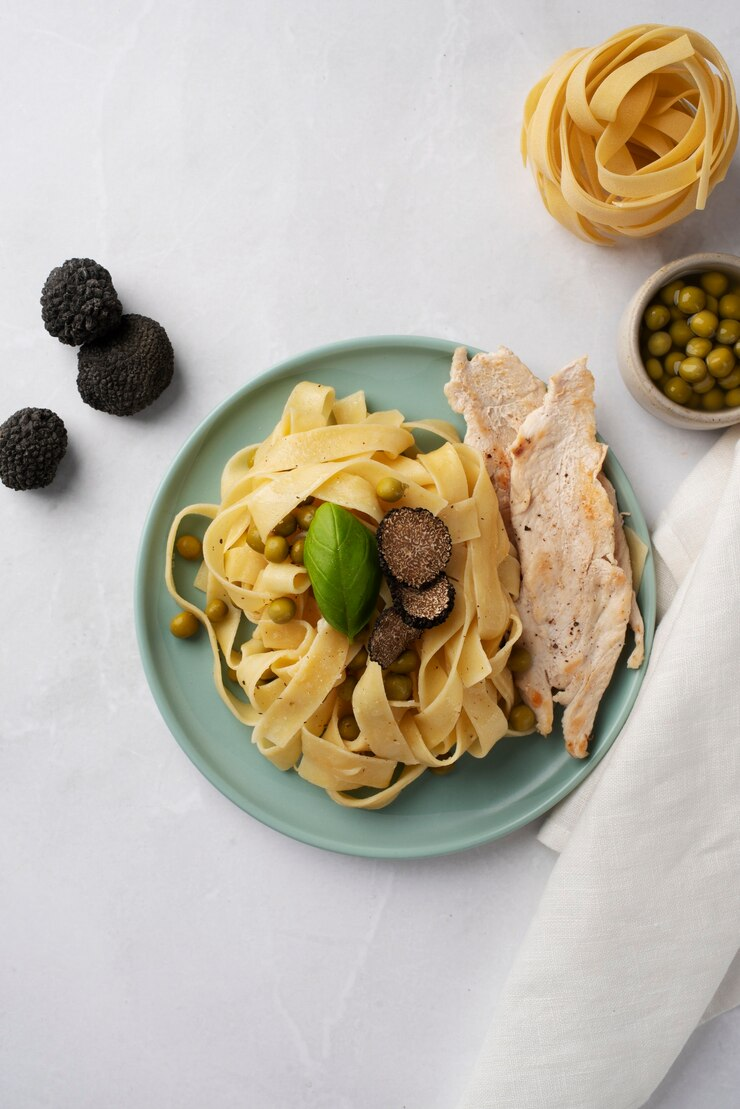
Chicken Fettuccine Alfredo
4.3
2,825
gCO2e
Sustainable Food
From Source to Plate
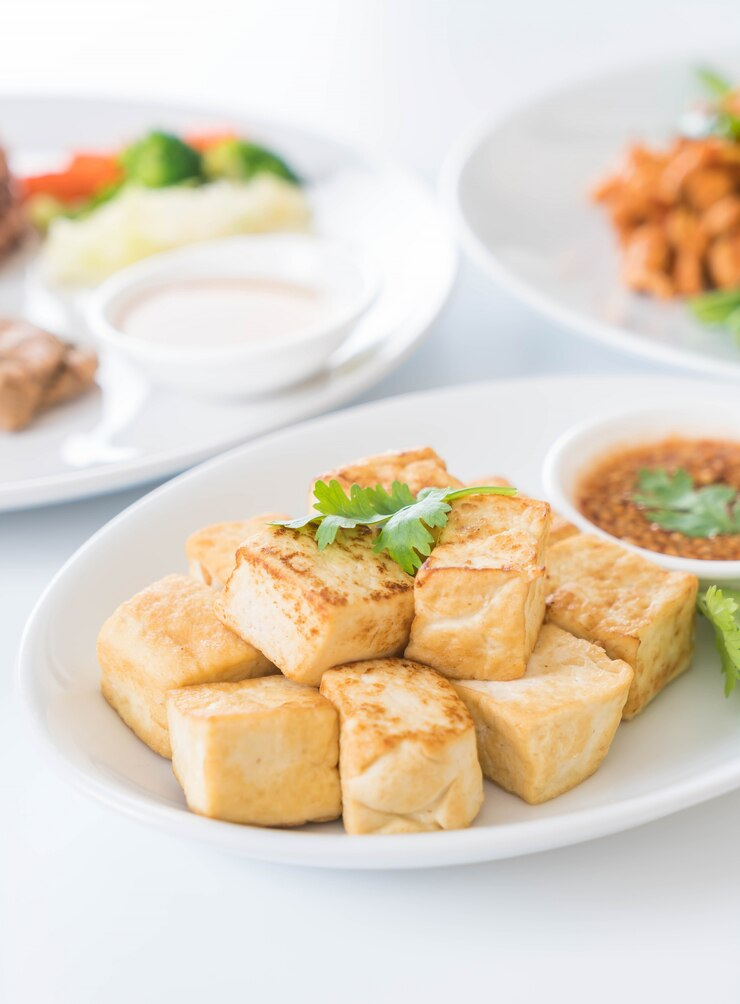
Pan Fried Tofu
4.3
970
gCO2e
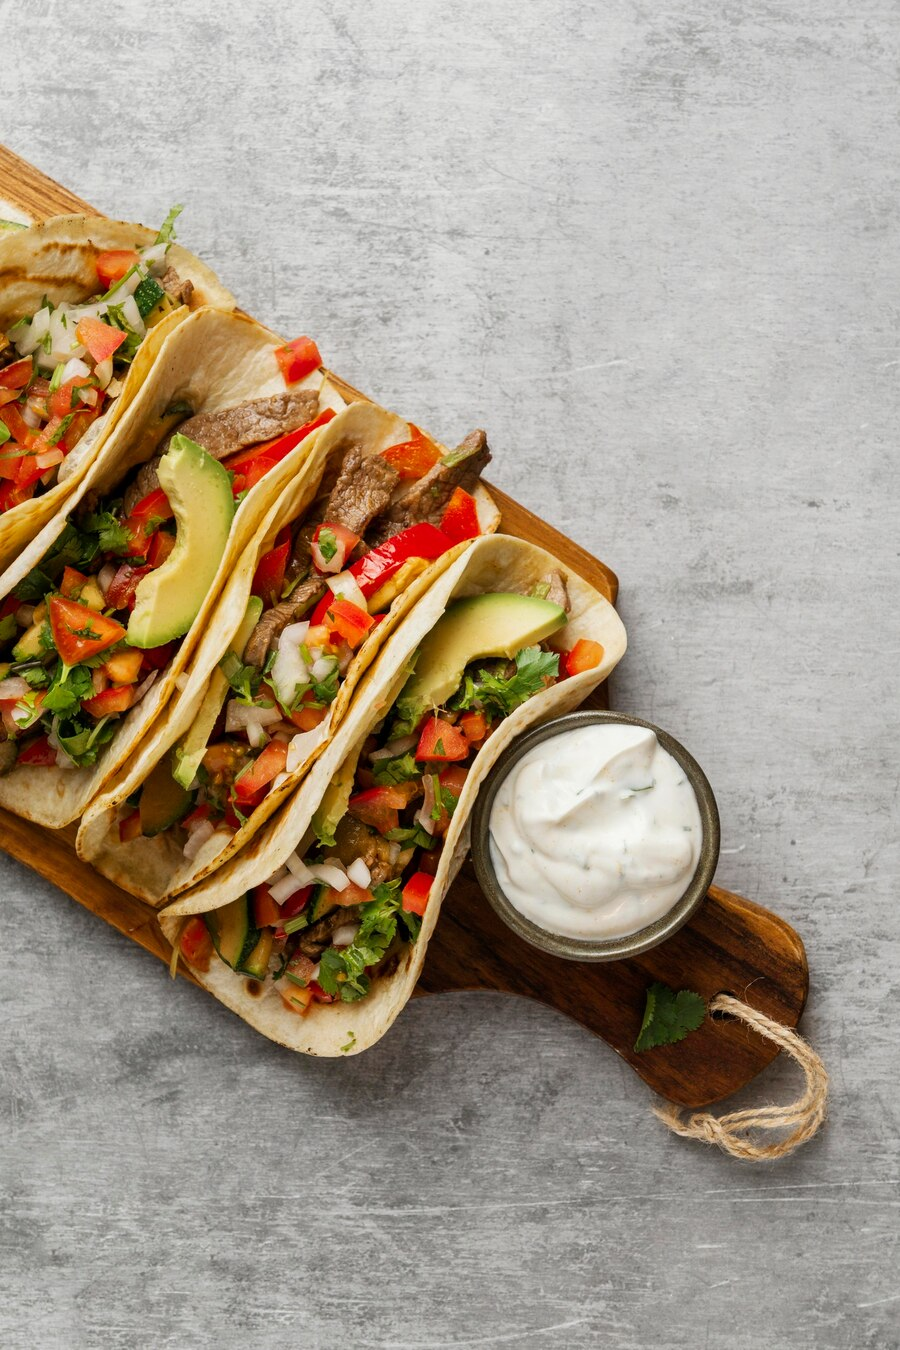
Impossible Tacos
4.7
341
gCO2e
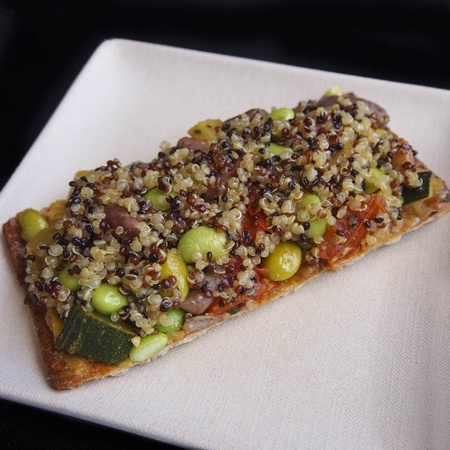
Vegetable Quinoa Cassoulet Flatbread
4.2
800
gCO2e

De Neve
Dining Hall
Filters

9:41

Explore

Menus
Analytics
Profile
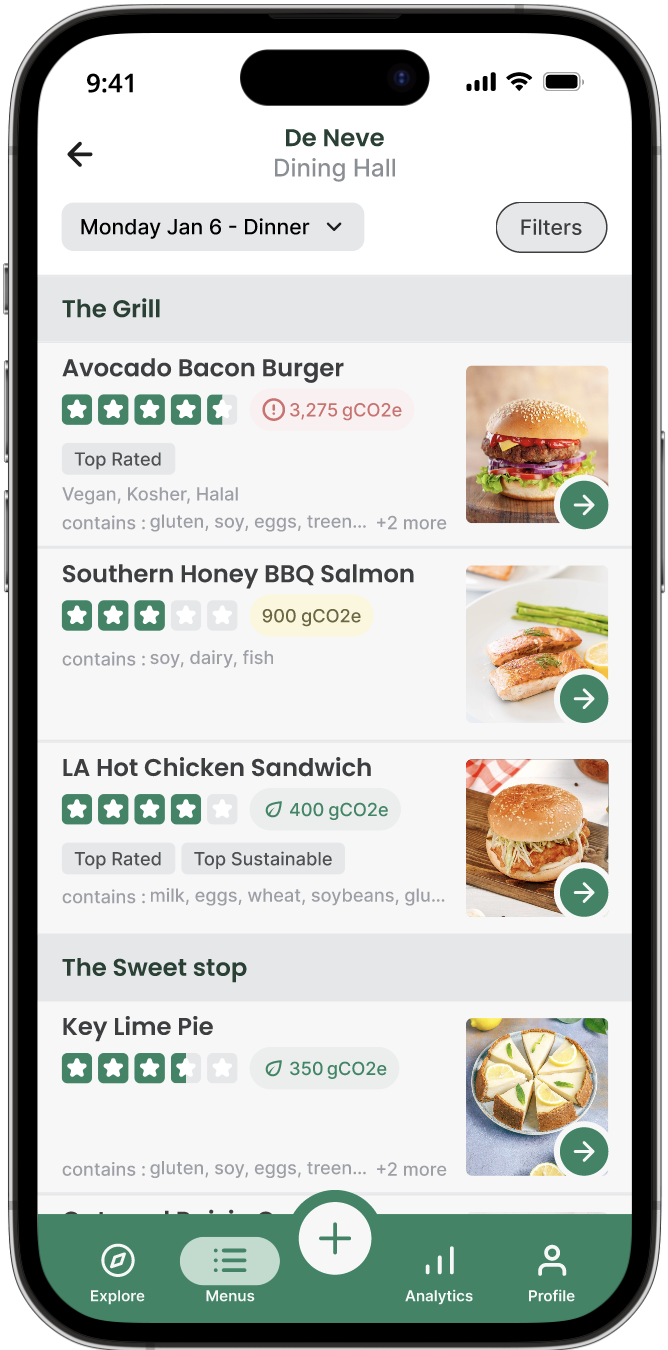
The Grill
Avocado Bacon Burger
3,275
gCO2e
Top Rated
Vegan, Kosher, Halal
contains :
gluten, soy, eggs, treenuts, dairy, wheat
+2 more
Southern Honey BBQ Salmon
900
gCO2e
contains :
soy, dairy, fish
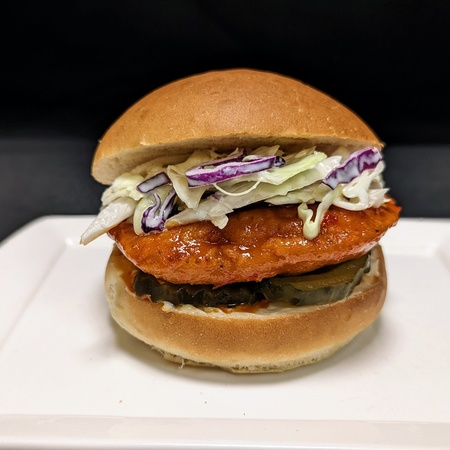
LA Hot Chicken Sandwich
400
gCO2e
contains :
milk, eggs, wheat, soybeans, gluten
The Sweet stop
Key Lime Pie
350
gCO2e
contains :
gluten, soy, eggs, treenuts, dairy, wheat
+2 more
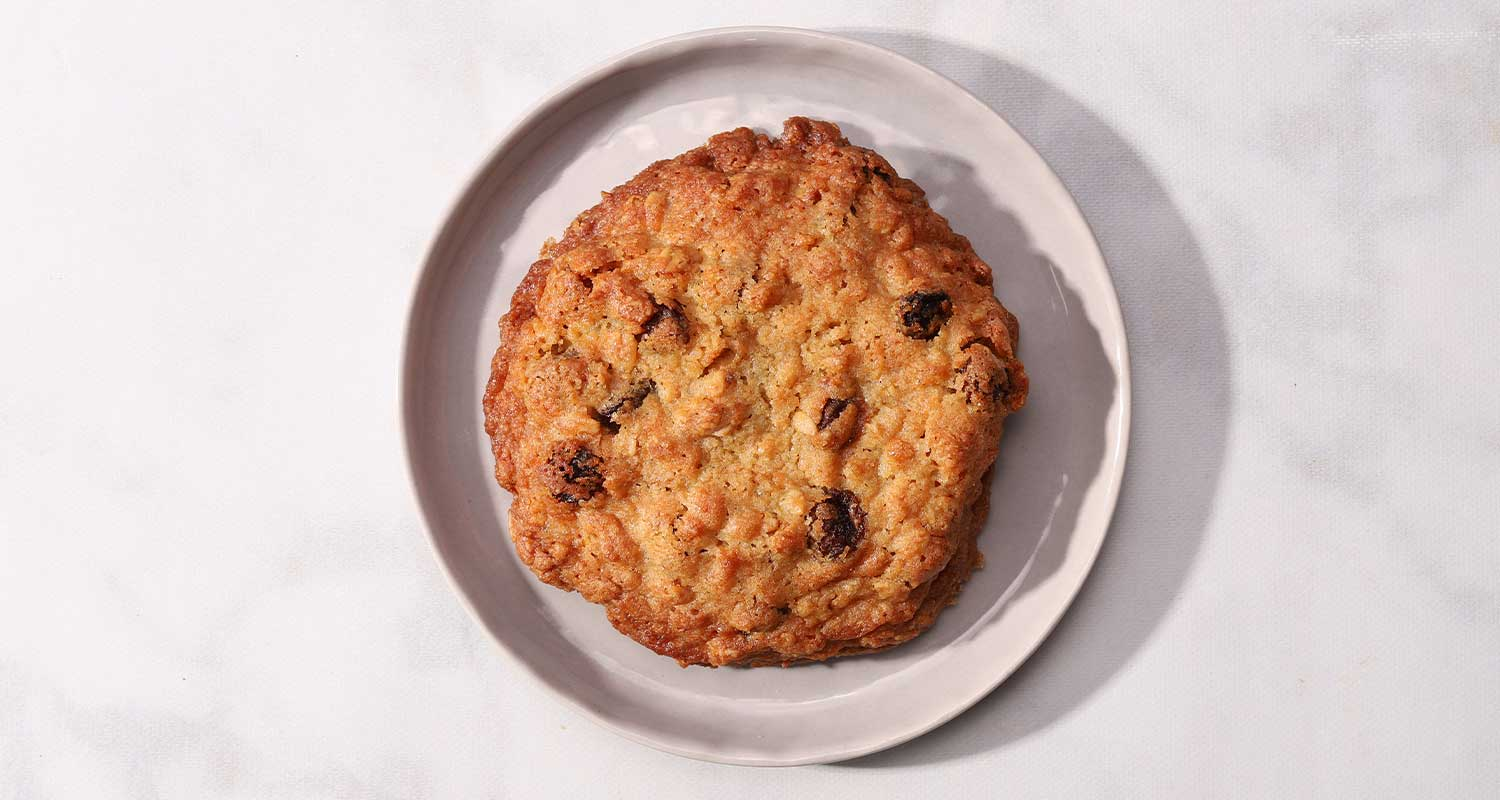
Oatmeal Raisin Cookie
150
gCO2e
Top Rated
Top Sustainable
contains :
gluten, soy, eggs, treenuts, dairy, wheat
+2 more
LA Hot Chicken Sandiwch

Fries
Previous
Rate Next
Add Review

9:41
LA Hot Chicken Sandwich
400
gCO2e
contains :
gluten, soy, eggs, dairy
serving(s)
400 gCO2e
Rate this dish

Notes
It’s too spicy for me 🥵🥵🥵

Did you finish your meal entirely?
No
Yes
Reason(s) for food waste
Ran Out of Time
Took Too Much
Big Servings
Food Quality
Dietary Restriction
Explore

Menus

Analytics
Profile
9:41
Analytics
9:41
CO2 Score Breakdown
Carbon Consumption (gCO2e)
4,000

3,000
2,000
1,000
0

Day
Mon
Tues
Wed
Thr
Fri
Sat
Sun


Your Carbon Consumption

Avg Student Carbon Consumption

Food Waste Counter
6 Dishes
Cumulative CO2 Score
14,390 gCO2e
Surplus Food Recovered
2 Dishes
Average Daily Carbon Score
On average you consume
1,100 gCO2e
That’s a moderate consumption

Highest CO2 Dish This Week
Avocado Bacon Burger
3,275 gCO2e
You had this for Lunch on Saturday Jan 4
Sustainability Tip
Try Bruin Dine!
Surplus food options diverts waste from landfills

Search
Filters
9:41

@hannah_banana

3
Hannah Chen

24

14
3,275
gCO2e

My Reviews
Favorites
Bookmarked
Explore
Menus
Analytics

Profile

You
were at
De Neve Dining Hall
for Dinner
Rates the
LA Hot Chicken Sandwich
It’s too spicy for me 🥵🥵🥵

Food Wasted
Taste Preference
Only Liked Some Parts
Rates the
Fries
Yum Fries
Meal Carbon Score
600 gCO2e
January 6 2024

2
You
were at
BPlate
for Dinner
Rates the
Cream of Tomato Soup
Pretty good, a bit sour for me though!
Food Wasted
Taste Preference
Rates the
Grilled Portobello Mushroom
Delicious no notes <3
Meal Carbon Score
1065 gCO2e
November 19 2024
2
Your
were at
BPlate
for Lunch
Rates the
Soy Garlic Grilled Flank Steak
So good! High carbon footprint...
Meal Carbon Score
12136 gCO2e
November 18 2024
0
reflection This was a first academic publishing for myself and my research team!
Originally we wanted to design a solution for the sustainability stakeholders but shifted to the student user base after hearing pain points during the interview.
Overall making a student facing app was the most practical for this project scope and leaves potential to expand on the admin-side food waste analysis platform concept.
Thanks for reading 💜💜💜

Keep in Touch!